
When it comes to running your advisor website, it’s crucial that you are tracking your analytics to ensure everything is running smoothly. There are 10,000 different metrics that you can track, which is A LOT to keep track of, so we’re breaking down seven of the most important ones you should be measuring.
7 Metrics for Financial Advisors to Track
The metrics below are SPECIFIC to measuring the success of your content, such as blog lists for other metrics. To track the overall success of your website, check out the blog below.
10 Google Analytics Metrics For Advisors To Track
1. Overall Traffic
Finding out the overall traffic of your website is crucial because you need to know the total amount of visitors so that you can monitor your site and then break down the other aspects. To find the overall traffic, go to Audience then Overview. From there you can see how many users are on your website and can set the date range in the top right corner to get a more narrowed down view of when your audience visited your site.

2. Organic Search Ranking
Organic search refers to unpaid search results, so if you show up in organic search rankings than it based on certain keywords or the relevance of the search. It’s important that you measure your organic search ranking so that you can see how your website is showing up in search engines when someone types in certain phrases or keywords.
When executed properly, organic search rankings can do the following.
- Increase your brand awareness
- Boost your long-term results and SEO rankings

3. Time Spent on Your Website
You only have a very limited amount of time to attract your audience once they land on your website. According to HubSpot, 55 percent of visitors spend fewer than 15 seconds on your website. Because of this, it’s crucial that you are communicating your Unique Value Proposition so that you can show your visitors what your company is about and why they should choose to work with you.
By tracking the time spent on your website, you can better understand if your content is reeling in your visitors and can see if they are quickly leaving or staying. At Twenty Over Ten, we usually tell advisors that anything above a two-minute session duration is very good for a niche site.
You can check on your site’s average session duration from the home section of your Google Analytics by going to Audience and then Overview. In the example below, you can see that the average session duration for the Twenty Over Ten blog is one minute and forty-nine seconds.

4. Pages Per Visit
Many times when someone comes to your site, they may be coming to read a blog post or check out a specific landing page, so it’s fairly common to have about one to two pages per visit. As you can see, Twenty Over Ten averages 1.79-page visits per each session. To find this section of your analytics, you simply go to Audience and then Overview once you have logged into your platform.

5. Returning Visitors
This is a great metric to track because if your visitors come back again to check out your website, this expresses their interest in your business. If you are creating strong blog content, videos, etc. then more people will return to see what information you have to offer them.
To find this on the dashboarding, then you select Audience on the left. Then click the Behavior drop-down and select New vs. Returning.

6. Social Sharing
Giving someone the option to share your content is such a good idea, and when you provide them with something valuable, then you want them to easily share your content. This simply opens up your content to a whole other audience on social platforms.
You can easily add these social sharing buttons using the Twenty Over Ten platform, just follow the simple steps below.
Step 1: From the homepage click “account login” from the top right or access our login page directly here.

Step 2: To add more categories for your blog posts you need to first access the Page Settings window. Hover over the page that contains your blog. Two icons will appear for ‘Post Settings’ (a capital ‘A’) and ‘Page Settings’ (a cog icon). Click on the cog icon.
Step 3: The Page Settings window will appear. Scroll down until you see Post Sharing. To control what social platforms your blog posts can be shared on, click the on or off switch for the desired social platform setting.
Step 4: Once you are finished changing the Post Sharing options click Save.
7. Clicks From Social Platforms
Social platforms can also give you analytics that you need for your posts. This data can be used as an extension of your analytics which in turn gives you additional insight to how the rest of your platform is working.
Facebook Analytics
You can find this by selecting the right website platform for which you’d like to view the social media report. In the below, we are checking out the metrics for the Twenty Over Ten Facebook platform. Simply click on insights and you can view many different things, such as Page Views, Page Likes, Post Reach, Post Engagement and much more.

Twitter Analytics
This can be easily found on the Twitter platform, as well. Simply click on More on the left-hand column, then click on Analytics. On your company’s marketing platform, you can see:
- The number of tweets sent
- Tweet impressions
- Profile visits
- Mentions
- Followers
- Your Top Tweet
- Your Top Mention
- And much more!
You can tailor other content that you put out based on which tweets performed the best, therefore working to get more engagement with your followers.
LinkedIn Analytics
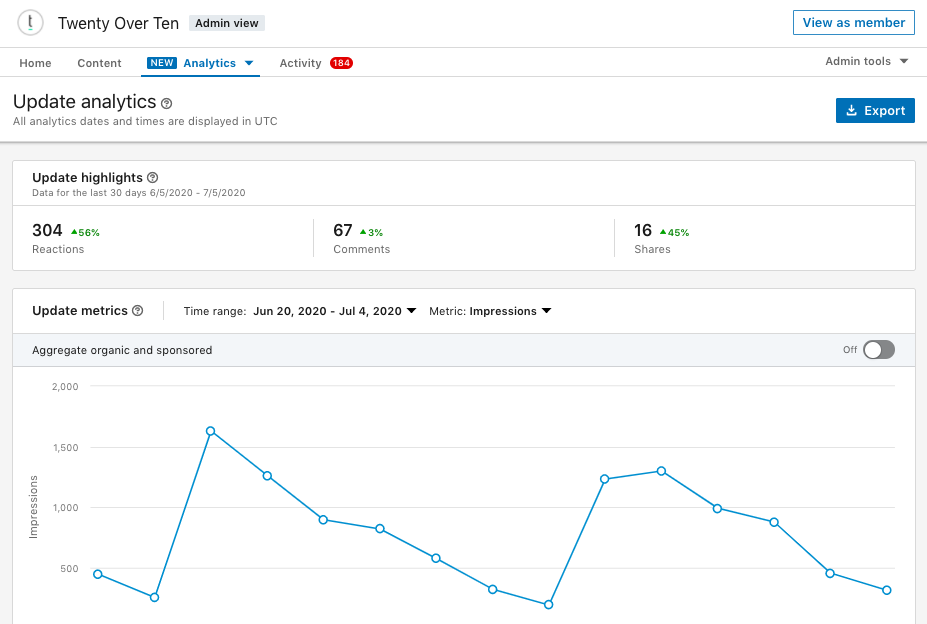
In LinkedIn, you can easily view the analytics by clicking on the analytics tab near the top left bar. You can get a read on the Visitors, Updates and Followers and see how your platform is performing. You can also see which posts are getting the most engagement, therefore tailoring more posts to try and get the same type of interaction.
Does Your Website Have What It Takes?
Continue to monitor your website and make sure that things are moving in the right direction. Improving your analytics and metrics isn’t going to happen overnight, so monitor these metrics, in addition to other ones that are offered and ensure that your metrics are improving. Reading these will help you to improve your website by tweaking the things that need it most and continuing to implement the ones that are working well for your firm’s website.
Struggling With What Content to Share on Social Media or via Email?
We are offering access to our content for advisors to use via Lead Pilot for 7-days completely free (even on our month to month plans).

About the author
Blair Kelly
Blair is a digital marketing assistant at Twenty Over Ten and has a passion for uncovering what drives online traffic and the highest engagement. She follows more animals on Instagram than humans and her greatest achievement is her daughter, Grey.